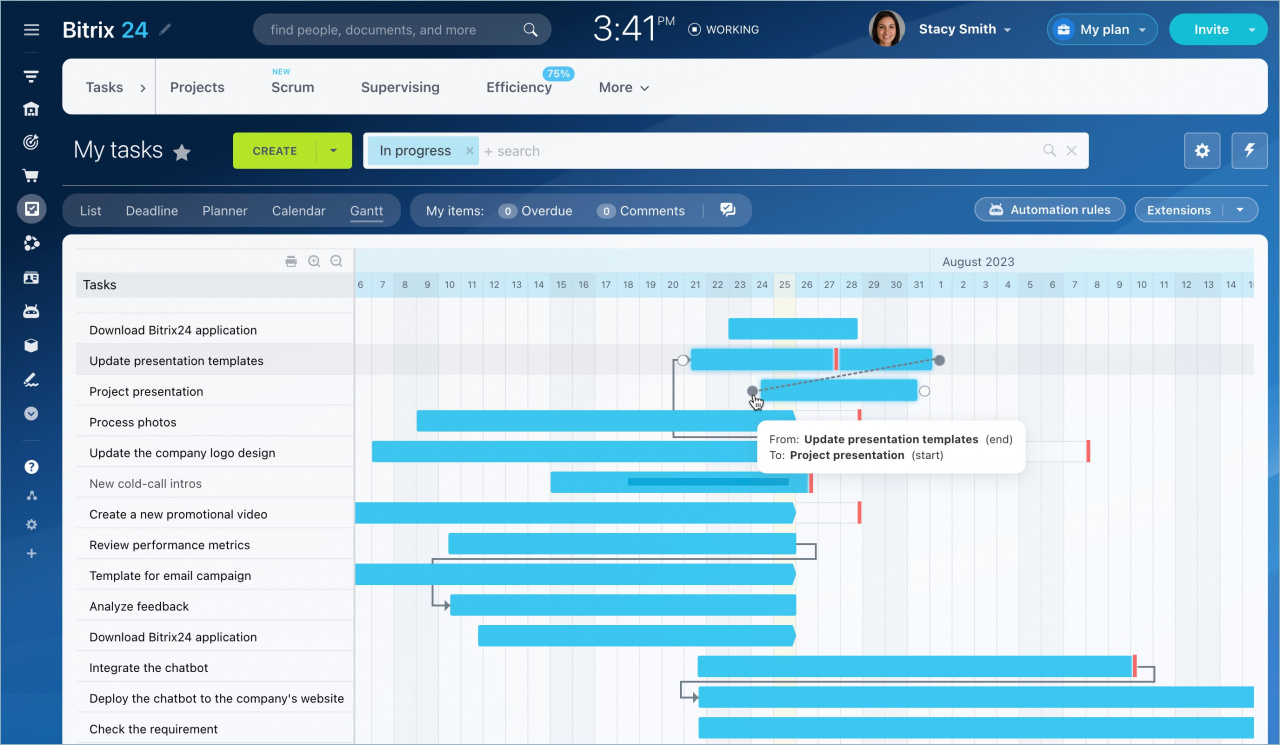
A Gantt chart is a type of bar chart that was developed specifically for illustrating project schedules, including task duration, deadlines, and dependencies. This tool is useful when planning tasks that need to be completed in a specific order, but do not have definite deadlines.
In Bitrix24 the chart provides a mechanism for the visual editing of the task schedule using task bars. Each task has the Start date, End date, and Deadline.
The left edge of the bar represents Start date.
The right edge of the bar determines End date.
The vertical red line displays Deadline.
Using the Gantt chart to view tasks and subtasks gives you a full picture of the project progress and helps to identify the delays.
The Start and End dates do not impact the task's deadline, but are used to indicate approximate dates and times for working on a particular task. Task dependencies determine the order in which tasks need to be performed. This allows you to visually indicate which tasks are primary and which ones are dependent.

Creating a dependency between tasks is simple, as you can drag a line between them.
The four most common dependency types are supported:
Finish to Start (FS): Task B is scheduled to start when Task A completes.
Start to Start (SS): Task B should not start before Task A starts.
Finish to Finish (FF): Task B should not finish until Task A is also completed.
Start to Finish (SF): Task B is scheduled to start before Task A completes.
For example, you can use the Finish-to-Start dependency type. This means that if you move the End date of the main task, the Start date of the dependent task will be adjusted accordingly.
Read more about how to use Bitrix24 Gantt chart and configure dependencies here.
Keep your entire team aligned and focused with Bitrix24’s free Gantt chart software.